

Medically reviewed by Dr. Kishan Srikanth Juvva, MD, DM (Pulmonary & Critical Care), Senior Consultant – Clinical & Interventional Pulmonology and Sleep Medicine, Apollo Hospitals, Financial District, Hyderabad
The short answer: A PFT (pulmonary function test) report compares your breathing measurements with what’s expected for someone of your age, height and sex. The three numbers that matter most are FVC (how much air you can blow out), FEV1 (how much in the first second), and their ratio. A low FEV1/FVC ratio points to an obstructive pattern, as in asthma or COPD. A low FVC with a normal ratio suggests a restrictive pattern, as in lung fibrosis, which is confirmed with lung volumes. DLCO shows how well oxygen passes from the lungs into the blood. Your doctor reads these together with your symptoms. One number on its own rarely gives the diagnosis.
PFT reports can look like a page of numbers and abbreviations. This guide takes you through a typical report column by column, explains the patterns doctors look for, and covers what it means when the test is “normal” but you’re still breathless.
PFT vs spirometry: are they the same?
Not quite. Spirometry is the most common part of a PFT, and often the only part. A “full PFT” adds more tests:
| Test | What it measures | When it’s used |
|---|---|---|
| Spirometry (with a reliever inhaler, “pre and post”) | How much air you can blow out, and how fast | Asthma, COPD, breathlessness, chronic cough. The first test for almost everyone |
| Lung volumes (body box / plethysmography, or gas dilution) | The total amount of air your lungs hold, and what’s left after breathing out | To confirm restriction (for example fibrosis), or to look for trapped air (COPD) |
| DLCO (diffusing capacity) | How well oxygen moves from the air sacs into the blood | Interstitial lung disease, emphysema, unexplained breathlessness, before some chemotherapy drugs |
| Impulse oscillometry (IOS) | Airway resistance during normal, relaxed breathing | Children, older adults, or anyone who finds forced blowing difficult; small-airway disease |
| FeNO (a separate breath test) | Inflammation in the airways | Supports an asthma diagnosis and guides inhaled-steroid treatment |
Peak flow is different again. It’s a simple home meter that measures only how fast you can blow out. It’s useful for tracking asthma day to day, but it can’t diagnose asthma or COPD the way spirometry can.
What the test involves and how to prepare are on our PFT page: pulmonary function test in Hyderabad.
Reading a spirometry report, column by column
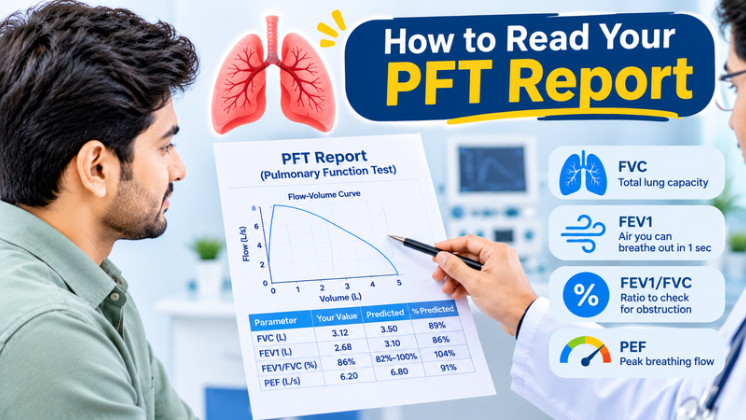
A typical spirometry table looks like this. The numbers below are an example only.
| Measured (pre) | Predicted | % Predicted | LLN | Z-score | Measured (post) | Change | |
|---|---|---|---|---|---|---|---|
| FVC (L) | 3.10 | 3.60 | 86% | 2.90 | −0.9 | 3.20 | +3% |
| FEV1 (L) | 1.95 | 2.95 | 66% | 2.35 | −2.3 | 2.30 | +0.35 L (12% of predicted) |
| FEV1/FVC | 0.63 | 0.81 | — | 0.70 | −2.4 | 0.72 | — |
| PEF (L/s) | 5.2 | 7.4 | 70% | — | — | 6.3 | — |
| FEF25–75 (L/s) | 1.1 | 3.0 | 37% | — | — | 1.8 | — |
What each row means
- FVC (forced vital capacity): the total amount of air you can blow out after a full breath in. Low FVC can mean the lungs can’t expand fully (restriction), or that air is trapped (severe obstruction), or simply that the blow wasn’t full.
- FEV1 (forced expiratory volume in one second): how much of that air comes out in the first second. It’s the key measure of airway narrowing, and it’s used to grade how severe COPD or asthma is.
- FEV1/FVC ratio: the share of your air that comes out in the first second. A low ratio is the hallmark of obstruction, meaning the airways are narrowed.
- PEF (peak expiratory flow): the fastest speed of your blow. It’s effort-dependent, and less useful than FEV1 for diagnosis.
- FEF25–75: the flow in the middle part of the blow. It’s sometimes low in small-airway disease, but it varies a lot and is rarely used alone.
What each column means
- Measured: your actual result.
- Predicted: the average for a healthy person of your age, height and sex, from a set of reference equations.
- % Predicted: your result as a percentage of the predicted value. The old rule of thumb was “80% or more is normal”. It’s still printed on many Indian reports, but it’s less accurate, especially in older and younger people.
- LLN (lower limit of normal): the cut-off below which only 5% of healthy people fall. Below the LLN is considered abnormal.
- Z-score: how many “standard deviations” you are from the predicted value. A z-score above −1.645 is within the normal range. The 2022 ERS/ATS interpretation standard recommends using z-scores and the LLN, rather than fixed percentage cut-offs.
- Pre / Post: results before and after a reliever inhaler. The change shows whether narrowed airways open up.
Reading the example: the FEV1/FVC ratio (0.63) is below the LLN (0.70), so there’s obstruction. FEV1 rose by 0.35 litres after the inhaler, about 12% of the predicted value. That’s a significant bronchodilator response, a pattern often seen in asthma. But the doctor would still interpret it alongside the symptoms.
Why “predicted” values can mislead in India
Predicted values come from reference studies of healthy people, and different machines use different equations. Indian studies show wide variation between prediction equations. A 2023 study of 583 healthy non-smoking adults in rural Vellore found that some existing Indian equations overestimated normal values, which meant they underestimated obstruction (Lung India). The 2022 standard recommends the Global Lung Function Initiative (GLI) equations where possible.
So a borderline result, close to the cut-off, should be interpreted carefully, with your symptoms and history in mind.
What is a “good” PFT result?
A normal spirometry result usually means:
- FEV1/FVC above the LLN (z-score above −1.645), so there’s no obstruction
- FVC and FEV1 above the LLN
- no significant change after the reliever inhaler
There isn’t a single “good” number for everyone, because normal values depend on your age, height and sex. Two people with an FEV1 of 2.5 litres can have very different results: normal for one, low for the other. That’s why reports compare you with your predicted value rather than with other people.
Obstructive vs restrictive: the main patterns
| Pattern | What the numbers show | What it suggests | Common causes |
|---|---|---|---|
| Normal | Ratio, FVC and FEV1 all within normal limits | No airflow limitation on this test | — (but see “normal PFT but breathless” below) |
| Obstructive | Low FEV1/FVC ratio; FEV1 often low; FVC normal or low | Narrowed airways: air can’t get out quickly | Asthma, COPD, bronchiectasis, chronic bronchitis |
| Obstructive, reversible | As above, and FEV1 or FVC rises significantly after the reliever | Airways that open up with medicine | Typical of asthma; some people with COPD also respond |
| Restrictive (suggested) | Low FVC with a normal or high ratio | The lungs may be smaller or stiffer, or the chest can’t expand fully | Lung fibrosis or ILD, obesity, chest-wall or muscle problems, fluid around the lung |
| Restrictive (confirmed) | Low total lung capacity (TLC) on lung volumes | True restriction | As above |
| Mixed | Low ratio and low TLC | Both problems together | For example COPD with fibrosis, or COPD with obesity |
An important caution about “restriction”: a low FVC on spirometry alone doesn’t prove restriction. It can also come from air trapping or an incomplete blow. A full lung-volume test is needed to confirm it.
On bronchodilator response: under the 2022 standard, a significant response is an increase in FEV1 or FVC of more than 10% of the predicted value. Older reports used “12% and 200 mL”. A response supports asthma but doesn’t separate asthma from COPD on its own. Which conditions each pattern can and can’t detect is covered in our upcoming post on what a PFT can show.
What does DLCO mean?
DLCO (diffusing capacity of the lungs for carbon monoxide) measures how easily gas passes from the air sacs into the bloodstream. You breathe in a small, safe amount of a test gas, hold your breath for about ten seconds, and breathe out. The machine measures how much was absorbed. It’s one of the most searched PFT terms in India.
| DLCO result | Commonly seen with |
|---|---|
| Low, with normal spirometry | Early interstitial lung disease, pulmonary hypertension or other lung blood-vessel problems, anaemia |
| Low, with obstruction | Emphysema (COPD with damaged air sacs) |
| Low, with restriction | Interstitial lung disease or pulmonary fibrosis |
| Normal, with restriction | Restriction from outside the lungs, such as obesity or chest-wall or muscle problems |
| High | Sometimes asthma, a high red-cell count, or bleeding into the lungs |
DLCO is usually adjusted for your haemoglobin level, so tell the lab if you’re anaemic or have had a recent blood test.
What if my PFT is normal but I’m still breathless?
This is common, and a normal spirometry result doesn’t mean your breathlessness is “in your head”. Spirometry measures airflow at one moment. It can miss:
- asthma that’s well controlled on the test day, or only triggered by exercise or cold air. A repeat test during symptoms, or a challenge test, may be needed.
- early interstitial lung disease or pulmonary vascular disease, which may show up only as a low DLCO, or on a CT scan
- heart problems, such as heart failure, valve disease or rhythm problems
- anaemia or thyroid problems
- dysfunctional breathing, where the breathing pattern rather than the lungs is the problem
- deconditioning after illness or a period of inactivity
- obesity, which adds to the work of breathing even when the lungs are normal
The next step is usually a careful history and examination, then targeted tests: DLCO, lung volumes, an ECG or echocardiogram, blood tests, a six-minute walk test, or a CT scan.
Getting the most accurate result
A PFT depends on effort and technique, so a few things make a difference:
- Follow the instructions about inhalers before the test, usually avoiding your reliever for a few hours, unless you need it.
- Avoid smoking, heavy meals and strenuous exercise just before the test.
- Wear loose clothing.
- Give it your best effort when the technician asks you to blow “hard and fast, and keep going”. The report usually notes whether the test met quality standards.
Full preparation instructions are on our PFT page: pulmonary function test in Hyderabad.
Getting your PFT report reviewed in Hyderabad
Dr. Kishan Srikanth Juvva is a pulmonologist in Hyderabad and Senior Consultant in Clinical & Interventional Pulmonology and Sleep Medicine at Apollo Hospitals, Financial District. He interprets lung function tests with your symptoms, scans and history, including reports from health checks or other centres. His qualifications:
- MD from Guntur Medical College
- DM in Pulmonary & Critical Care Medicine from VMMC & Safdarjung Hospital, New Delhi (All India Rank 2, NEET Super Speciality)
- Master’s in Interventional Pulmonology from the University of Florence, Italy
| Apollo Hospitals, Financial District | Breathe Well Clinic, Kondapur | |
|---|---|---|
| Tests | Spirometry, lung volumes, DLCO | Spirometry and FeNO |
| Timings | Monday–Saturday, 9:00 AM–5:00 PM | Monday–Saturday, 5:00–8:30 PM |
| Address | 1st Floor, Room 3, Apollo Hospitals, Financial District, Nanakramguda | 1st Floor, Kadiri’s Apurupa Urban Apartments, Botanical Garden Road, beside Aparna Heights, Kondapur |
| Book | +91 90598 73547 | +91 87122 23696 |
Bring with you: your full PFT report (including the graphs and the pre/post page), any earlier reports for comparison, your inhalers, and a note of your symptoms.
Frequently asked questions
1. What is a normal FEV1/FVC ratio?
A normal FEV1/FVC ratio is one above your lower limit of normal (LLN), which depends on your age. In younger adults it’s usually above about 0.75–0.80, and it falls naturally with age. Many reports still use a fixed 0.70 cut-off. A ratio below your LLN suggests airway obstruction, as in asthma or COPD.
2. What does FEV1 mean in a PFT report?
FEV1 is the forced expiratory volume in one second: the amount of air you can blow out in the first second of a forceful breath. It’s the main measure of airway narrowing, compared with the predicted value for your age, height and sex. Doctors use it to grade asthma and COPD severity and track response to treatment.
3. What is the difference between obstructive and restrictive lung disease?
In obstructive disease, such as asthma or COPD, narrowed airways make it hard to blow air out quickly, so the FEV1/FVC ratio is low. In restrictive disease, such as lung fibrosis, the lungs can’t expand fully, so total lung volume is low but the ratio is normal or high. Confirming restriction needs lung-volume testing.
4. What does a low DLCO mean?
A low DLCO means gas isn’t passing as easily from the air sacs into the blood. It’s commonly seen with interstitial lung disease, emphysema, pulmonary hypertension and anaemia. A low DLCO with otherwise normal spirometry can be an early clue to lung-tissue or blood-vessel problems, and usually needs further tests such as a CT scan.
5. Is a PFT the same as spirometry?
Not exactly. Spirometry measures how much air you can blow out and how fast. It’s the most common part of a PFT. A full PFT can also include lung volumes, DLCO (gas transfer) and sometimes impulse oscillometry. Your doctor chooses which tests you need based on your symptoms.
6. Can my PFT be normal if I have asthma?
Yes. Asthma symptoms come and go, so spirometry can be normal on a good day, especially if you’re taking a preventer inhaler. If asthma is still suspected, your doctor may repeat the test during symptoms, add a FeNO test, check peak flow at home, or arrange a challenge test.
Medically reviewed by Dr. Kishan Srikanth Juvva, MD, DM (Pulmonary & Critical Care), Senior Consultant, Apollo Hospitals, Financial District, Hyderabad. This article is for general information and doesn’t replace a consultation with your doctor.
Sources
- Stanojevic S, Kaminsky DA, Miller MR, et al. ERS/ATS technical standard on interpretive strategies for routine lung function tests, European Respiratory Journal 60(1): 2101499, 2022 (z-scores and LLN at the 5th percentile; bronchodilator response above 10% of predicted for FEV1 or FVC; GLI equations recommended; lung volumes to confirm restriction)
- McGinnis A. Guideline update changes best practices for assessing lung function, CHEST Physician, 14 Nov 2022 (summary of the changes, including the bronchodilator-response definition and FeNO guidance)
- Christopher DJ, Oommen AM, George K, Premkumar PS, Shankar D, Agrawal A, Thangakunam B. Rural South Indian spirometry values show wide variation compared to existing prediction equations, Lung India 40(3): 193–199, 2023 (583 healthy non-smokers, rural Vellore; existing equations can underestimate obstruction)